Trading Calendar Heatmap
Spot the patterns a spreadsheet hides. Which days bleed money? Which sessions print? Click any day to drill into the trades that made or broke it.
A closer look
What you'll spot
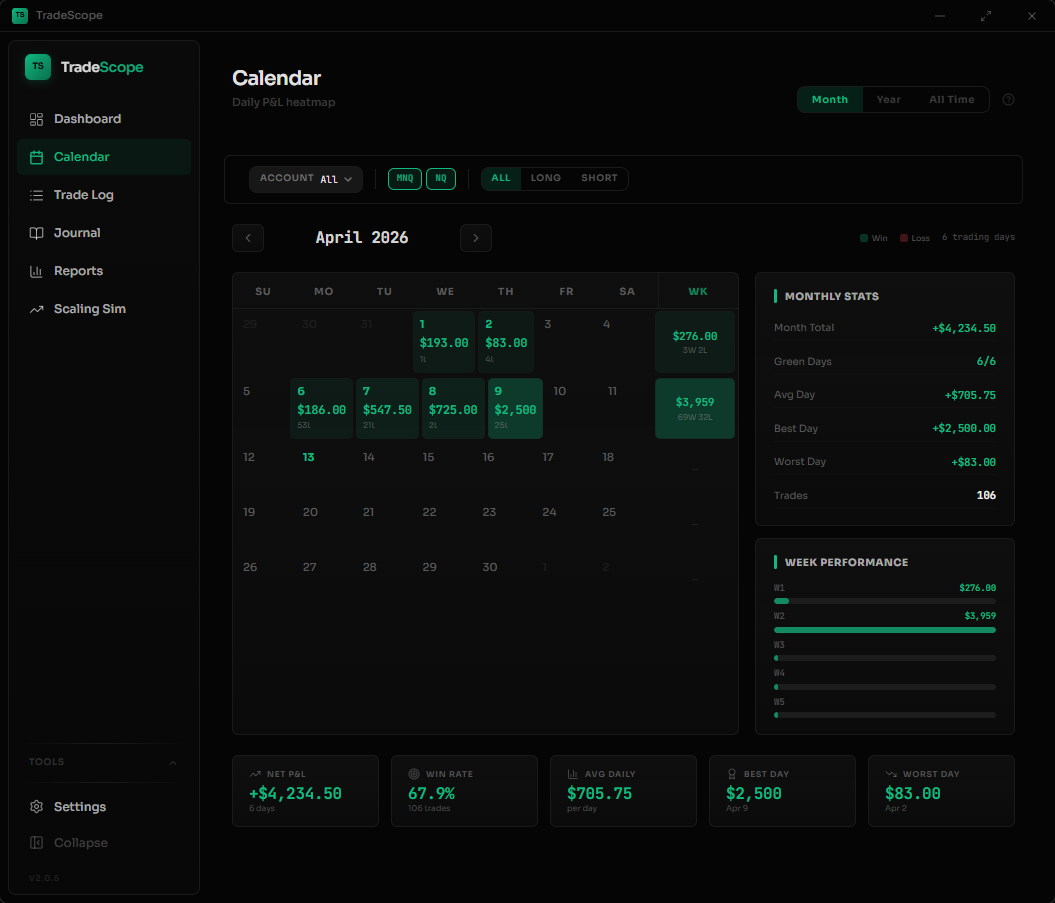
Daily P&L at a glance
Every trading day is color-coded green or red based on your net P&L. Spot winning streaks, losing streaks, and flat periods instantly without reading a single number.
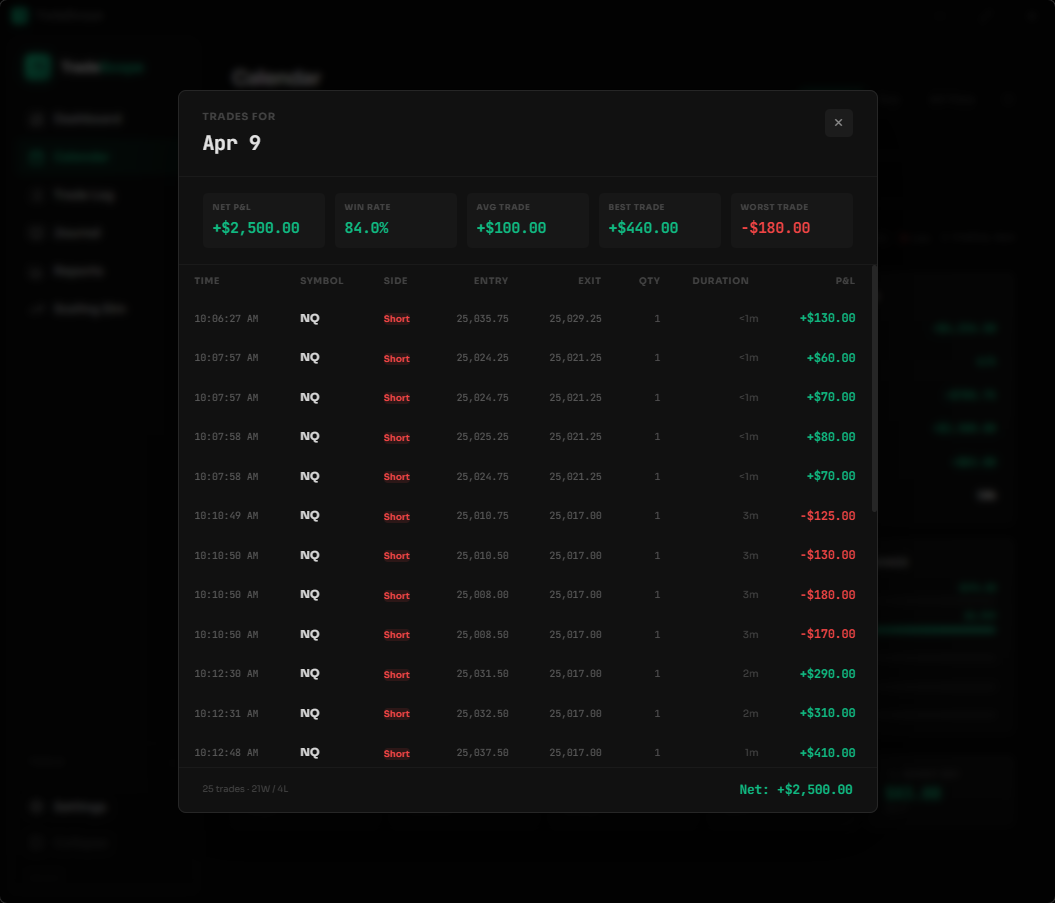
Click any day to drill in
Select a day to see every trade you took - entry/exit times, symbol, side, P&L, and duration. No switching pages or running reports.
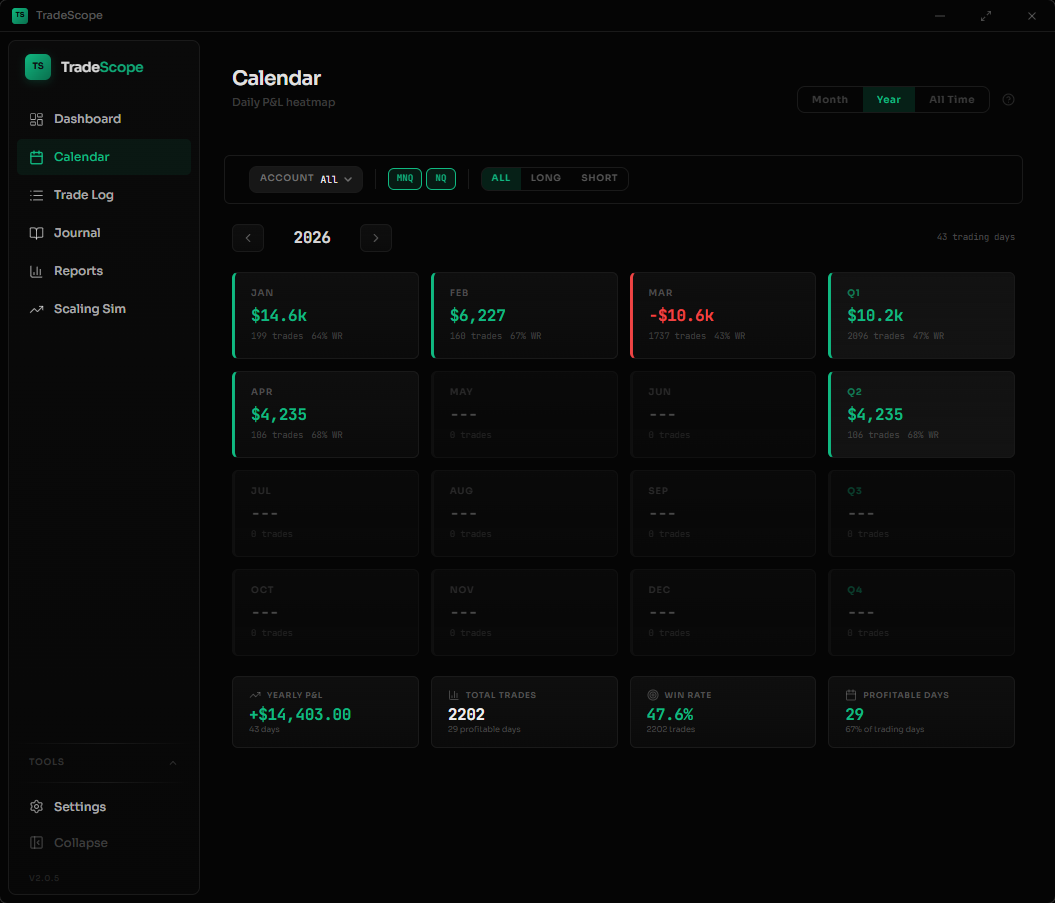
Monthly and yearly summaries
See total P&L, trading days, win/loss day counts, and best/worst days for any month. Switch to yearly view for quarterly breakdowns.
Day-of-week patterns
Are Mondays your worst day? Do you crush it on Wednesdays? The calendar makes recurring patterns obvious so you can adjust your schedule.
Account filtering built in
Filter the calendar by account group - see only your funded accounts, only sim, or everything together. Each view recalculates all stats.
Keep exploring
Why a Trading Calendar Matters
Most traders review their performance through spreadsheets or generic P&L summaries. The problem is that numbers alone hide patterns. A trading calendar heatmap shows you what no spreadsheet can — the rhythm of your trading week, which days consistently cost you money, and whether your winning streaks are real or just variance.
TradeScope's calendar is built specifically for NinjaTrader 8 futures traders. Your trades sync automatically — no CSV exports, no manual entry. Open the app and your calendar is already populated with every trade from your NinjaTrader database, organized by day with P&L color-coding.
For prop firm traders managing multiple evaluation and funded accounts, the account filter lets you isolate performance by account group. See how your Apex account performed this month separately from your Topstep account, or combine everything for the full picture.
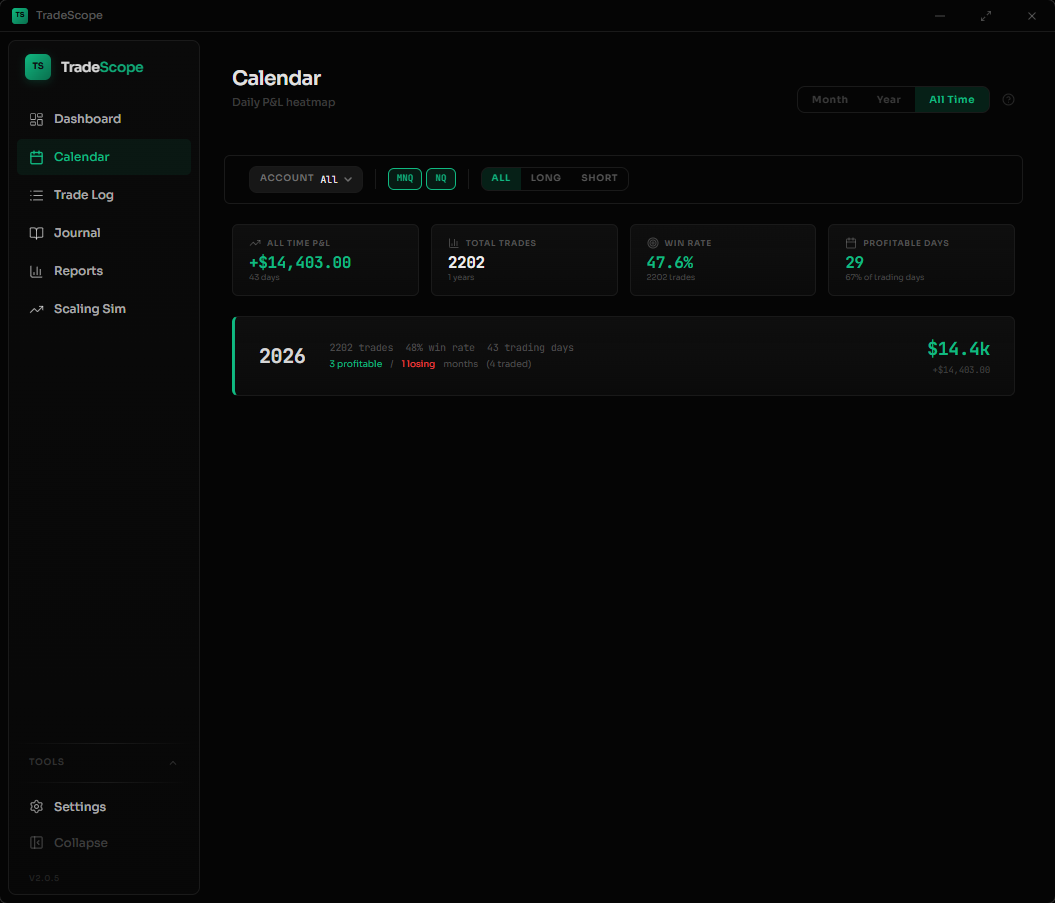
The three calendar views — Month, Year, and All Time — give you the right level of detail for any question. Reviewing today's session? Use Month view. Checking quarterly progress? Year view shows monthly P&L cards with Q1-Q4 totals. Want the big picture? All Time shows your lifetime performance across every year you've traded.
Frequently Asked Questions
Can I see my NinjaTrader trades on a calendar?
Yes. TradeScope automatically syncs your NinjaTrader 8 trades and displays them on a calendar heatmap. Each day is color-coded by P&L so you can see your best and worst trading days at a glance.
Does the trading calendar work with prop firm accounts?
Yes. You can filter the calendar by account group — funded accounts, evaluation accounts, sim accounts, or all together. Each view recalculates stats independently.
Can I see monthly and yearly trading performance?
TradeScope's calendar has three views: Month (daily P&L heatmap with weekly totals), Year (monthly P&L cards with quarterly breakdowns), and All Time (lifetime summary across all years). Click any month or year to drill in.
Do I need to enter trades manually?
No. TradeScope reads your NinjaTrader 8 trade database directly. Your trades appear on the calendar automatically after each sync — no exports or imports required.
Learn more about tracking your trading performance in our complete guide to NinjaTrader performance tracking, or see how TradeScope compares to other options in our best trading journal for NinjaTrader 8 comparison.
Get TradeScope
One-time purchase. No subscription. 30-day money-back guarantee.
Get TradeScope — $19.99